

When parents first begin learning about behavior analysis, it can feel like a whole new language. Terms like reinforcement, intervention, baseline, and data collection are often introduced quickly, especially during discussions about treatment planning. One phrase that sometimes causes confusion is the “ABBA pattern.” It sounds technical at first, but the idea behind it is actually simple once it is broken down clearly.
For families exploring services like ABA therapy Highland Park, TX, understanding how behavior patterns are measured can make therapy feel much more approachable. Data collection is one of the most important parts of Applied Behavior Analysis because it helps therapists see whether a strategy is truly helping a child make progress. The ABBA pattern is one of the ways professionals observe changes in behavior over time.
In this blog, we will explain what an ABBA pattern is, why it matters in behavioral treatment, and how these patterns are graphed in real-world therapy settings.
Understanding the Basics of an ABBA Pattern
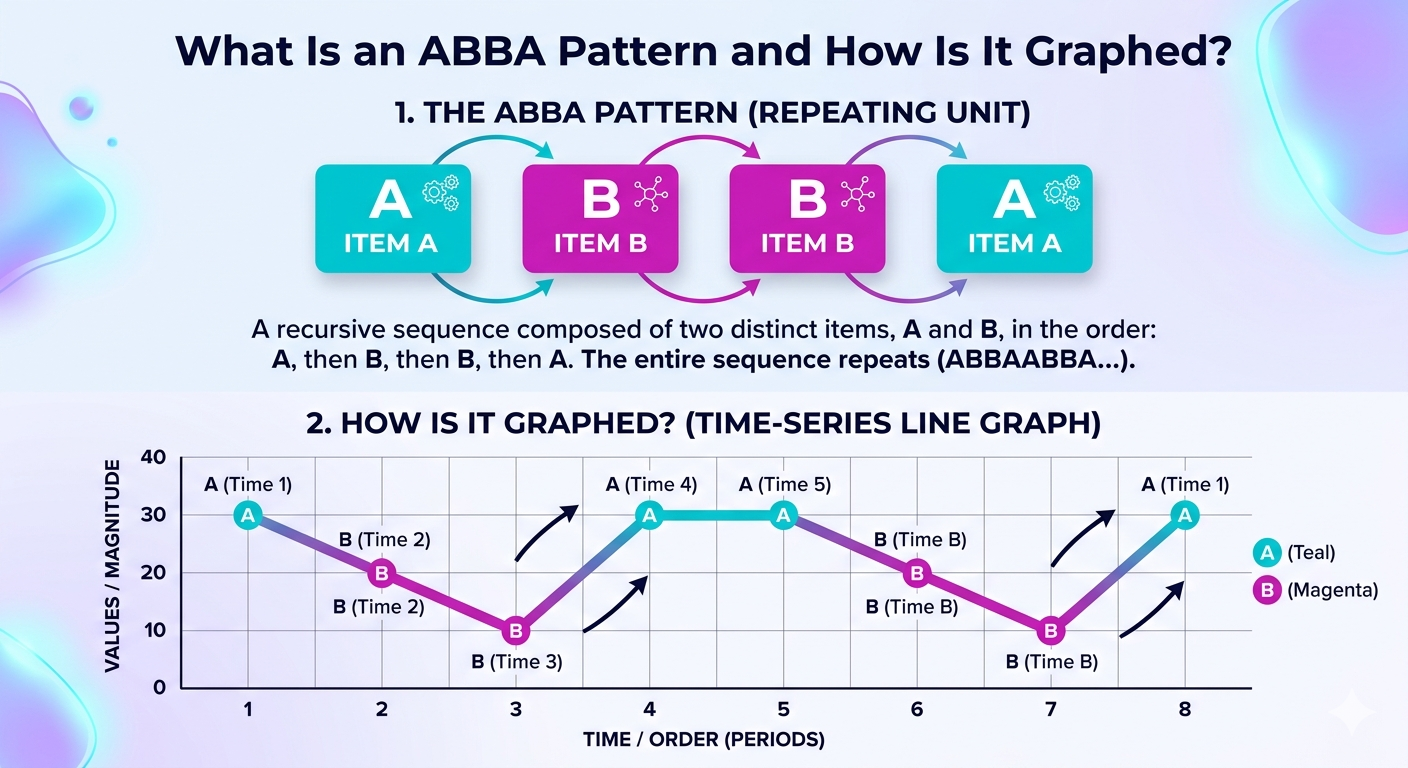
An ABBA pattern is a type of experimental design used in behavior analysis to evaluate whether a treatment or intervention is making a meaningful difference. The letters themselves represent different conditions.
- “A” stands for baseline.
- “B” stands for intervention or treatment.
The pattern follows this sequence:
- Baseline
- Intervention
- Baseline again
- Intervention again
This setup allows therapists to compare behavior changes during different stages of treatment. By removing and then reintroducing an intervention, professionals can observe whether the behavior improves, decreases, or remains the same.
The reason this structure matters is because it helps demonstrate whether a therapy strategy is actually responsible for behavioral change rather than outside factors.
For example, a child may struggle with frequent task refusal during homework sessions. A therapist may first observe the behavior without introducing any changes. This becomes the first baseline phase. Then the therapist introduces a reinforcement strategy designed to encourage task completion. If the behavior improves, the intervention appears effective.
Next, the intervention may temporarily stop so the therapist can see whether the original behavior returns. Finally, the strategy is introduced again to confirm the results.
This process creates the ABBA sequence.
Why the ABBA Pattern Matters in ABA Therapy
Behavior analysis is built around evidence-based decision-making. Therapists do not rely on guessing or assumptions. Instead, they use measurable observations to determine whether a child is benefiting from a specific strategy.
The ABBA approach helps professionals answer important questions:
- Is the intervention truly helping?
- Is the behavior changing consistently?
- Are outside variables affecting progress?
- Should the treatment plan continue or be adjusted?
Families looking for Autism Treatment Highland Park often want reassurance that therapy decisions are supported by real data rather than opinions alone. The ABBA model provides a structured way to monitor progress and improve treatment quality.
Whether a child receives Center-Based ABA or Home-Based ABA Therapy, data collection remains a central part of treatment planning.
How an ABBA Pattern Is Graphed
Graphing is one of the easiest ways to visualize an ABBA pattern. ABA professionals use graphs to track behaviors across different phases of treatment.
The graph usually contains two main components:
- The horizontal axis (X-axis), which represents time or sessions.
- The vertical axis (Y-axis), which represents the behavior being measured.
The graph is divided into sections that correspond with each phase:
- A = Baseline
- B = Intervention
- B = Return to baseline conditions
- A = Return of intervention
Therapists often use vertical lines to separate each phase visually.
Step 1: Baseline Phase
The first baseline phase shows how often a behavior occurs before treatment begins.
For example:
- A child may engage in aggressive behavior 10 times during each session.
- No intervention is added yet.
- The therapist simply records the frequency.
On the graph, this phase may appear relatively stable with little change.
Step 2: Intervention Phase
Next, the therapist introduces a treatment strategy.
This could include:
- Positive reinforcement
- Visual supports
- Structured routines
- Communication prompts
If the intervention works, the graph may show the behavior decreasing over time.
For example:
- Aggressive behaviors drop from 10 incidents to 4 incidents per session.
This downward trend becomes visible during the “B” phase.
Step 3: Return to Baseline
During the next stage, the intervention is removed temporarily.
The purpose is to determine whether the behavior changes again without treatment.
If the problem behavior increases after the intervention is removed, it suggests the strategy was helping.
The graph may show the behavior rising again.
Step 4: Reintroduction of Intervention
Finally, the therapist reintroduces the original intervention.
If the behavior decreases once more, the graph provides stronger evidence that the intervention is effective.
The final phase often mirrors the earlier improvement pattern.
What Professionals Look for on the Graph
When reviewing ABBA graphs, therapists look for clear visual patterns.
Some of the most important details include:
Level
This refers to the average rate of behavior during each phase.
For example:
- High aggression during baseline
- Lower aggression during intervention
Trend
Trend describes whether behavior is increasing, decreasing, or remaining stable.
Variability
Variability shows whether the behavior changes dramatically from session to session.
Consistent data is easier to interpret than highly unpredictable data.
Immediacy of Change
Therapists also examine how quickly behavior changes after an intervention begins.
A sharp improvement immediately following treatment introduction can be a strong indicator that the strategy is effective.
Real-Life Example of an ABBA Pattern
Imagine a child who has difficulty remaining seated during learning activities.
A therapist providing in-home ABA therapy Dallas begins tracking how many times the child leaves their chair during a 30-minute session.
First Baseline Phase
The child leaves their seat:
- 15 times
- 14 times
- 16 times
No treatment changes are introduced.
Intervention Phase
The therapist introduces a token reward system.
Now the child leaves their seat:
- 10 times
- 7 times
- 5 times
Return to Baseline
The token system is removed.
The behavior increases again:
- 12 times
- 14 times
- 15 times
Reintroduction of Intervention
The reward system returns.
The child leaves their seat:
- 8 times
- 5 times
- 4 times
When graphed visually, the pattern becomes very clear. The intervention appears connected to improved behavior.
Why Families Should Understand ABA Graphs
Many parents feel overwhelmed when first reviewing behavioral data. Graphs may look intimidating at first glance, especially during meetings with therapists or treatment teams.
However, understanding the basics can help parents feel more confident and involved in their child’s progress.
Families participating in ABA Parent Training often learn how to interpret these graphs so they can better understand treatment recommendations.
When parents understand the visual data:
- Progress becomes easier to recognize.
- Therapy goals feel more measurable.
- Communication with therapists improves.
- Parents can better support consistency at home.
This is especially valuable for families receiving parent training for autism because collaboration between caregivers and therapists plays a major role in long-term success.
ABBA Patterns in Different Therapy Settings
The ABBA model can be used in many environments.
Home Settings
Children participating in Home-Based ABA Therapy may have behaviors tracked during routines like:
- Mealtime
- Bedtime
- Homework
- Transitions
Home-based data can provide valuable insight into daily functioning.
Clinic Settings
Children attending center-based autism services often work on social interaction, communication, and learning readiness.
Graphs may track:
- Peer engagement
- Task completion
- Communication requests
- Reduction of challenging behavior
Professionals working in behavioral therapy Park Cities settings often rely on visual data to make individualized treatment decisions.
The Importance of Ethical Use
Although ABBA designs are valuable, therapists use them carefully.
In some situations, removing an effective intervention may not be appropriate, especially if the behavior could place a child or others at risk.
Ethical ABA providers always prioritize safety and well-being when designing treatment plans.
Professionals serving families searching for ABA providers 75205 understand the importance of balancing scientific accuracy with compassionate care.
How Technology Has Improved Graphing
Years ago, therapists often drew graphs by hand. Today, many clinics use digital systems that automatically organize behavioral data.
Modern graphing software allows therapists to:
- Track progress faster
- Identify trends more clearly
- Share updates with parents
- Adjust treatment plans efficiently
This has helped improve communication between families and providers.
Clinics focused on pediatric behavioral health Highland Park frequently use digital tools to maintain organized records and support individualized care.
Common Misunderstandings About ABA Graphs
Some parents worry that graphs reduce children to numbers or statistics. In reality, graphs are simply tools that help therapists measure progress objectively.
The purpose of graphing is not to label children.
Instead, graphs help answer questions like:
- Is communication improving?
- Are meltdowns decreasing?
- Is the child gaining independence?
- Is the treatment approach working?
Behind every graph is a child learning important life skills and a family hoping to see meaningful growth.
Final Thoughts
The ABBA pattern is one of the many tools used in Applied Behavior Analysis to understand behavior change over time. While the concept may sound technical initially, it becomes much easier to understand when viewed step by step.
By comparing baseline behavior with intervention phases, therapists can identify strategies that truly support progress. Graphs make those patterns visible, helping families and clinicians make informed decisions together.
Whether a child receives Center-Based ABA services or participates in Home-Based ABA Therapy, data collection remains an essential part of quality care. Families exploring ABA therapy Highland Park, TX often find comfort in knowing that treatment decisions are guided by careful observation, measurable outcomes, and individualized planning.
When parents understand how ABBA patterns work and how they are graphed, they become stronger partners in the therapy process. That collaboration can make a meaningful difference in helping children build communication, independence, and everyday life skills.
Contact us at 972–310–4991 or visit https://radiantspectrumtherapy.com/ to learn more.